Zoom on Chartism, Support and Resistance
Zoom - Chartism, Support and Resistance
By Crypto Nation – 09 December 2020
Chartist patterns allow to obtain technical indicators by linking points of interest on a price chart.
They help define and trace support and resistance lines. Crossing these levels give sell or buy signals. All chartist figures are in close relation to maths and probabilities. They are used in order to predict the future of the price.
We will divide this zoom into two categories of chartist patterns: continuation patterns and reversal patterns. Continuation patterns indicate a continuation of the current trend. They are the sign of a consolidation and a probable resumption of the current upward or downward trend. Conversely, reversal patterns indicate an upcoming trend reversal. They show that the current trend is weakening.
Continuation chartist patterns
Continuation chart patterns announce a continuation of the trend. The figure exit is done in the direction of the movement preceding the figure formation.
In a downtrend, a continuation pattern indicates a continuation of the bearish movement. Conversely, in an uptrend, the figure announces a continuation of the bullish movement.
Continuation chart patterns allow the asset to consolidate the current trend movement without questioning it. These patterns offer entry points to take advantage of the trend. But beware, whatever the extent of the consolidation within the pattern , we must wait for a signal to resume the trend before taking a position. This signal can be a reversal following a point of contact with one of the lines of the figure or an exit from the continuation figure, in the direction of the trend.
List of some continuation chartist patterns:
Pennant
The pennant usualy appears after a sudden movement (bearish or bullish).
A pennants life span is short.
The exit trend of a pennant depends on the entry movement. It can be formed in a upward or downward trend.
The target price of a pennant is calculated in relation to the trend that preceded its formation. Usually traders report the full height of the move leading up to the formation of the pennant to the last low/high point in the pattern.

- In 90% of the cases, a pennant is a continuation pattern.
- In 75% of the cases, the exit is in the same direction as the entry.
- In 55% of the cases, the objective of a pennant is reached.
Cup and handle
Formed by two rounded hollows, the first being deeper and wider than the second.
The tops of the cup and the handle are aligned on the same horizontal resistance line. This line is called the neck line of the cup and handle figure.
For the figure to be valid, several rules must be respected:
- The cup figure with handle must be preceded by a significant upward movement.
- The low of the cup trough must be less than 50% of the uptrend that preceded pattern formation.
- The lowest point of the handle should be less than 50% of the height of the cup.
The shape of the two troughs may make one think of a rounding bottom, which reflects the progressive exhaustion of sellers. Buyers gradually regain control once the neckline is crossed (psychological threshold), the buying force then becomes very strong.
The objective of the figure in cup and handle is calculated by deferring the height of the cup to the point of breakage of the handle.

- In 79% of the cases, the output of a cup and handle figure is bullish.
- In 73% of the cases, the objective of the cup figure and handle is reached (half the height of the cup), after breaking the neck line.
- In 74% of the cases, after exit, the price performs a support pullback on the neck line.
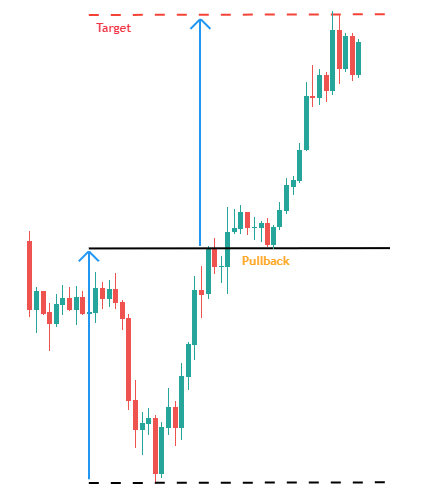
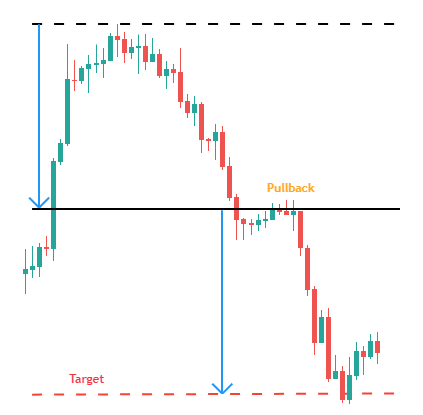
Ascending Triangle and Descending Triangle
These chartist patterns are formed by two converging lines.
The first straight line is a bullish slant providing support, also known as the “triangle support line”.
The second line is a horizontal resistance, also known as the “triangle resistance line”.
The triangle is valid if there is an oscillation between the two lines.
Each of these lines must have been touched at least twice to validate the figure.
The price objective of an ascending or descending triangle is determined by the height of the base of the triangle which is carried over to the breakout point. Another technique is to draw a line parallel to the triangle’s support/resistance line from the first contact with the resistance/support.
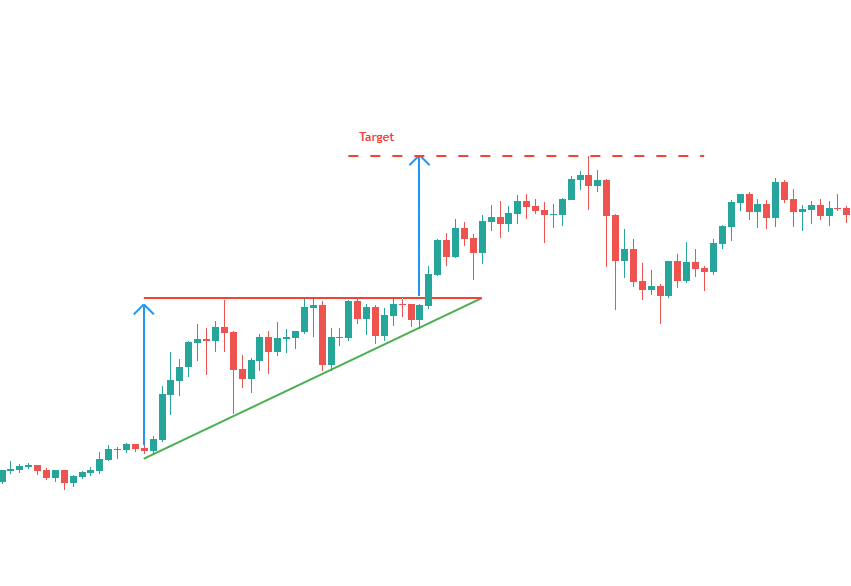
Statistics of the ascending triangle:
- In 62% of the cases, the exit is bullish.
- In 75% of the cases, the ascending triangle is a continuation figure.
- In 75% of the cases, the triangle’s price target is reached when resistance is broken on the upside (exit from ascending triangle).
- In 60% of the cases, after the breakout the price performs a support pullback on the line of resistance of the triangle.
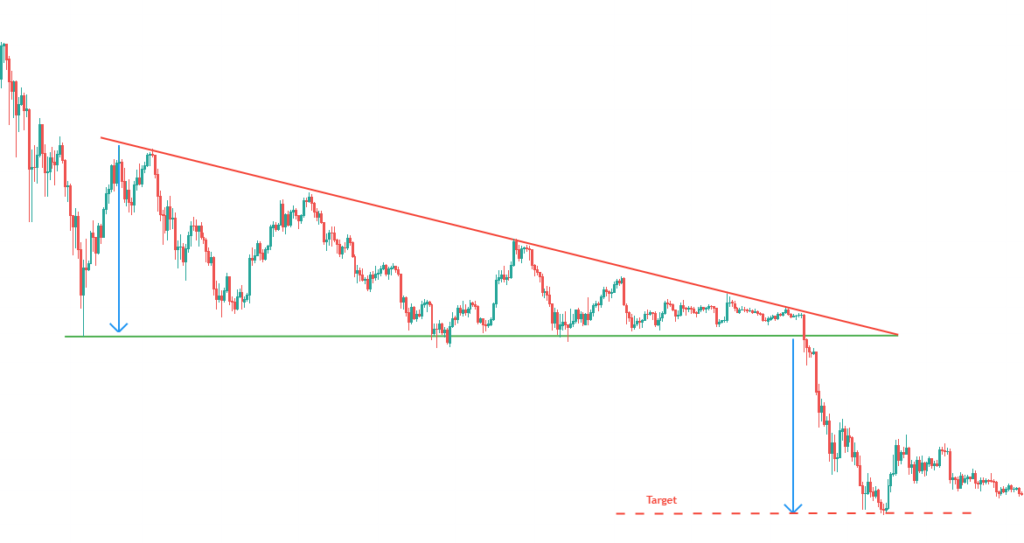
Statistics of the descending triangle:
- In 54% of the cases, the exit is bearish.
- In 61% of the cases, the descending triangle is a continuation figure.
- In 54% of the cases, the triangle’s price objective is reached when the support is broken downward (exit from the descending triangle).
- In 64% of the cases, after the breakout, the price performs a resistance pullback on the line of support of the triangle.
Symmetrical vertex triangle and Symmetrical trough triangle
These patterns are formed by two converging trend lines symmetrical with respect to the horizontal.
For the symmetrical triangle to be said “top”, the movement preceding the formation of the triangle must be bullish. For the symmetrical triangle to be said “hollow”, the movement preceding the formation of the triangle must be bearish.
The symmetrical triangle is valid if there is an oscillation between the two lines.
Each of these lines must have been touched at least twice to validate the figure.
The price target of a symmetrical triangle is determined by the height of the base of the triangle reported to the breakout point (exit of the triangle). Another technique is to draw a line parallel to the triangle’s support/resistance at the first contact with the resistance/support.
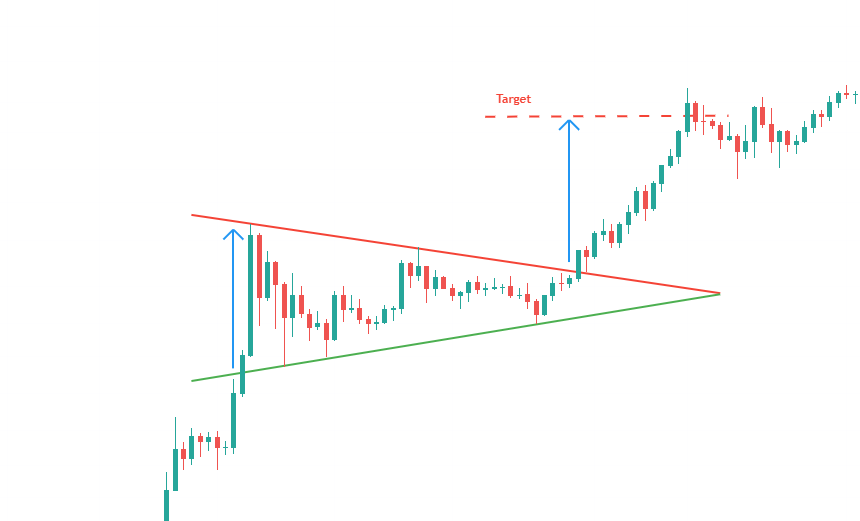
Statistics of the symmetric vertex triangle:
- In 63% of the cases, the exit of the top symmetrical triangle is bullish.
- In 89% of the cases, the bullish movement continues after exiting the triangle.
- in 81% of the cases, the price manages to reach the price objective of the triangle in the event of an exit from the top.
- In 60% of the cases, the price performs a support pullback on the line of resistance of the triangle.
Statistics of the symmetrical triangle of trough :
- In 57% of the cases, the exit of the symmetrical trough triangle is bearish.
- In 91% of the cases, the bearish movement continues after exiting the triangle.
- In 57% of the cases, the price manages to reach the price objective of the triangle in the event of a bottom exit.
- In 60% of the time, the price performs a resistance pullback on the support line of the triangle.
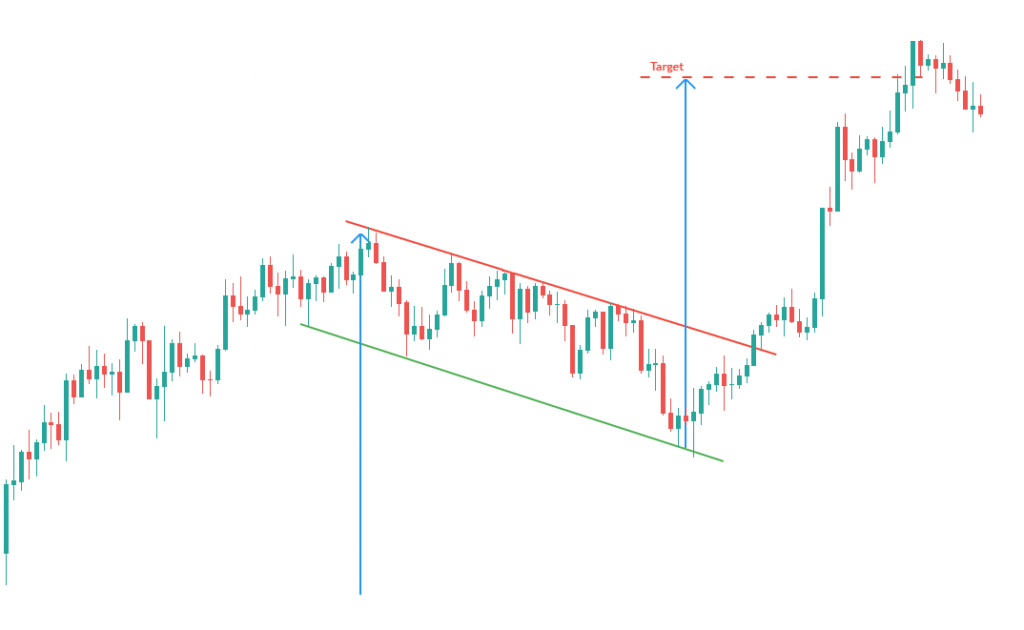
Ascending Flag and Descending Flag
The flag is a continuation figure. It is formed by two parallel lines which form a rectangle. It is therefore oriented in the opposite direction of the trend that it consolidates. Unlike a channel, this figure is very “short term” and marks the need for sellers/buyers to take a break.
The formation of the ascending flag occurs in a downtrend. Most often, this pause occurs halfway through the movement. Conversely, the formation of the descending flag occurs in an uptrend.
The calculation of the objective is done in relation to the initial trend. The height of the entire movement preceding the formation of the flag is calculated and then this height is transferred to the last high/low point in the figure.
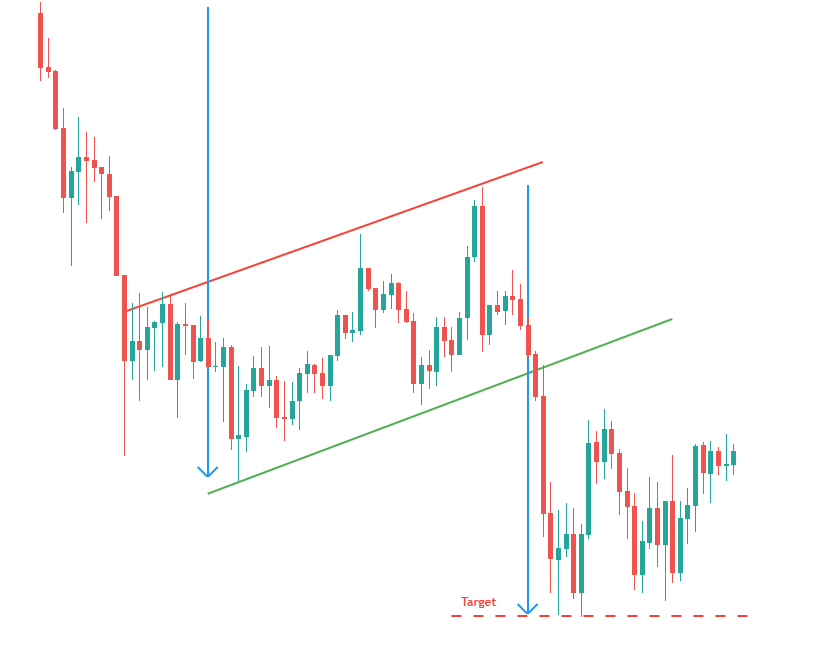
Statistics on the ascending flag:
- In 90% of the cases, this is a continuation figure.
- In 87% of the cases, there is a bearish exit.
- 76% of ascending flags occur in the bottom 1/3 of the annual range.
- In 62% of the cases, the figure’s objective is achieved.
Statistics on the falling flag:
- In 90% of the cases, this is a continuation figure.
- In 87% of the cases, there is a bullish exit.
- 76% of descending flags occur in the upper 1/3 of the annual range.
- In 62% of the cases, the figure’s objective is achieved.
Reversal chartist patterns
Reversal chart patterns announce a reversal of the current trend.
In an uptrend, a reversal pattern announces a bearish movement. Conversely, in a downtrend, it announces a bullish movement.
We must not anticipate the exit of the figure. A reversal chart pattern is validated only when the price comes out of the pattern (break of the neck line or the bullish/bearish slant).
List of some chartist reversal patterns:
Rising wedge and Failing wedge
The wedge is a chartist figure formed by two converging straight lines.
The wedge is valid if there is an oscillation between the two lines. Each of these lines must have been touched at least twice to validate the figure.
A wedge marks the shortness of the buying or selling current. The convergence of the two lines in the same direction (decrease in the amplitude of the prices) informs us that the prices continue to evolve with movements of amplitude less and less strong.
The breakout of the support/resistance line definitively validates the pattern. This break is generally accompanied by high volumes. The price target is determined by the lowest/highest point that caused the bevel to form.
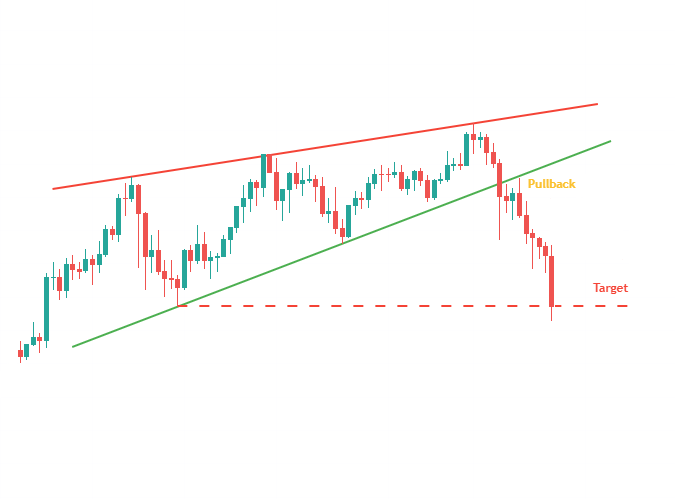
Ascending wedge statistics:
- In 82% of the cases, the exit is bearish.
- In 55% of cases, the ascending bevel is a reversal figure.
- In 63% of cases, the figure’s goal is achieved when the support line is broken.
- 53% of the time, the price performs a resistance pullbacks on the support line of the ascending wedge.
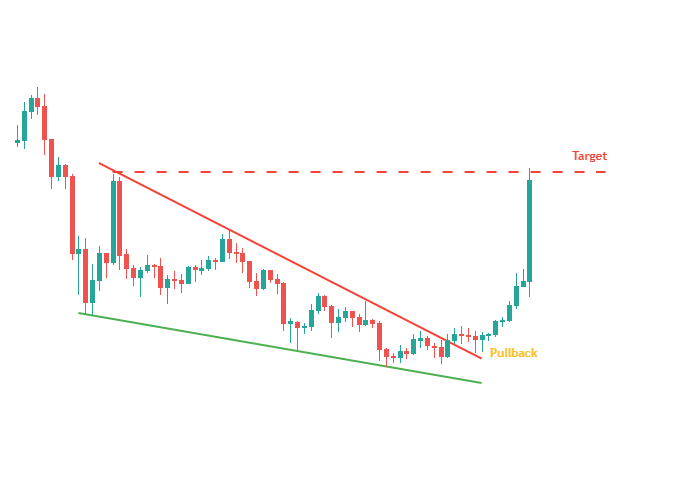
Descending wedge statistics:
- In 82% of the cases, the exit is bullish.
- In 55% of the cases, the descending wedge is a reversal figure.
- In 63% of the cases, the target in the pattern is achieved when the resistance line is broken.
- In 53% of the cases, the price perform a support pullback on the line of resistance of the downward wedge.
V Bottom and V Top
Brutal back and forth movements, underlying a high volatility. Two trend reversal figures.
V bottom: in a bearish trend (also sometimes in bullish trends).
V top: in a bullish trend (also sometimes in bearish trends).
The theoretical objective of the figure is the distance between the neck line and the lower/upper V which is transferred to the neck line.
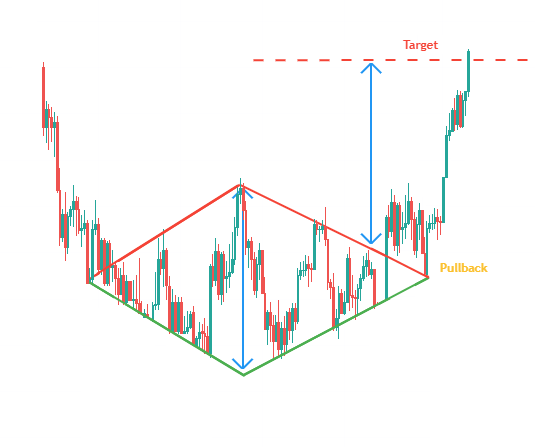
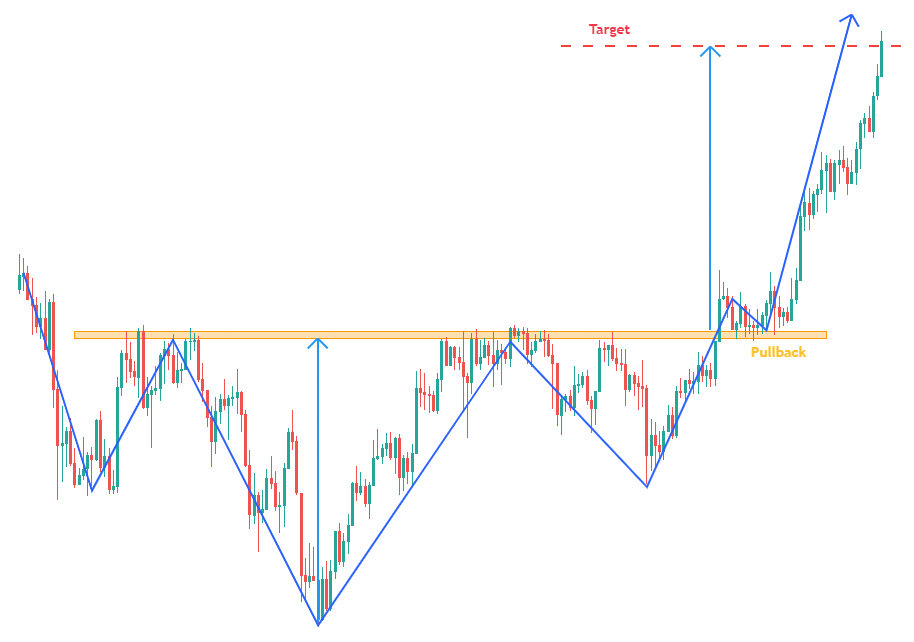
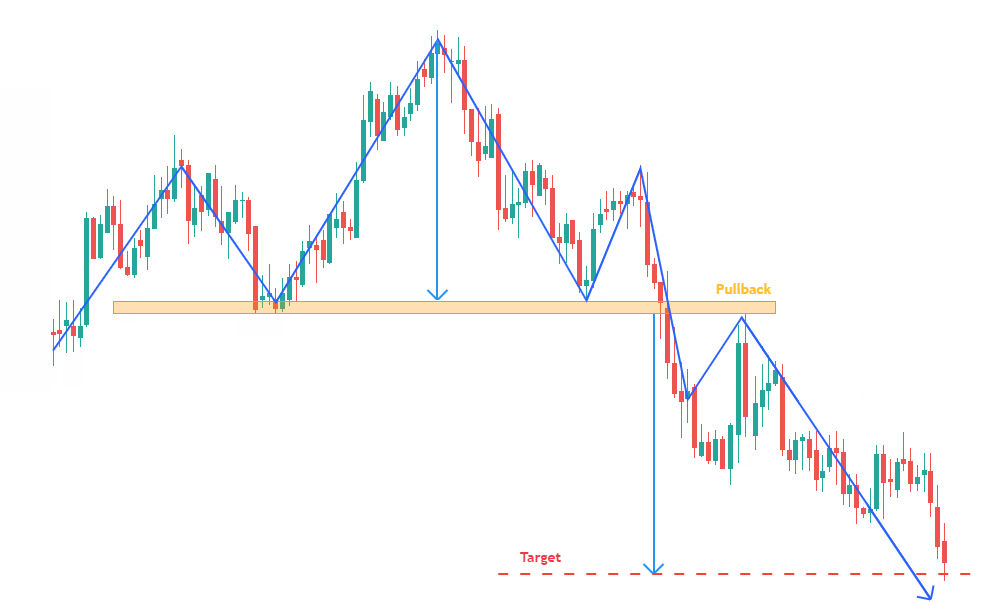
Double Bottom (W) and Double Top (M)
Figures having the form of a W or an M.
Double Bottom (W): bullish chart pattern. The price successively makes two troughs (lower) at approximately the same level, indicating significant support.
This chart pattern shows investors’ desire not to let the price reach new lows, and their desire to reverse the current trend.
Double Top (M): bearish chart pattern. The price makes two successive peaks at approximately the same level, indicating significant resistance.
This chart pattern shows investors’ desire not to let the price reach new highs, and their desire to reverse the current trend.
The goal of a double bottom figure is calculated by plotting the height of the figure above the neck line.
The objective of a double top figure is calculated by plotting the height of the figure below the neck line.
When validating these patterns, it is common for the course to pullback on the neck line before reaching the objective of the figure.

Double Bottom Statistics:
- In 70% of the cases, the movement is bullish after a double bottom.
- In 67% of the cases, the goal of the double bottom figure is achieved when the neck line is broken.
- In 97% of the cases, the bullish movement continues at the break of the neck line of the double bottom figure.
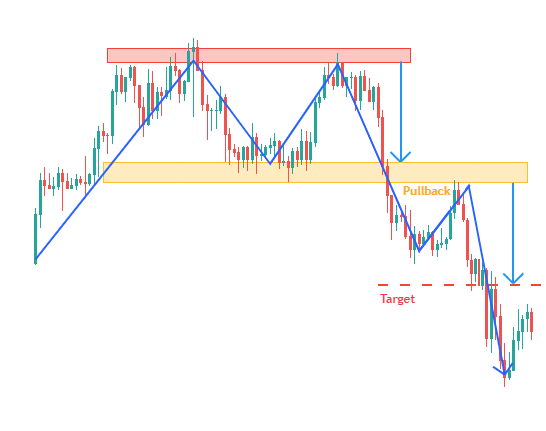
Double Top Statistics:
- In 75% of the cases, the movement is bearish after a double top.
- In 83% of the cases, the course breaks the neck line of the double top figure.
- In 83% of the cases, the bearish movement continues at the break of the neck line of the double top pattern.
Diamond Bottom and Diamond Top
The diamond is a trend reversal chart pattern. It is formed by two symmetrical juxtaposed triangles, thus forming a diamond.
Diamond Bottom: preceded by a downtrend. This figure marks the shortening of the current seller and the indecision of investors.
Diamond Top: preceded by an uptrend. This figure marks the weakening of the buying trend and the indecision of investors.
Volatility and swings are increasing in the first half of the pattern, then decreasing in the second half of the pattern.
The price target of a diamond is calculated by reporting the maximum/minimum height of the diamond at the exit point.
In general, the exit movement is as fast as the down/up movement that preceded it.
Diamond Bottom Statistics:
- In 82% of the cases, the exit of a hollow diamond is bullish.
- In 79% of the cases, the price target for a hollow diamond is reached.
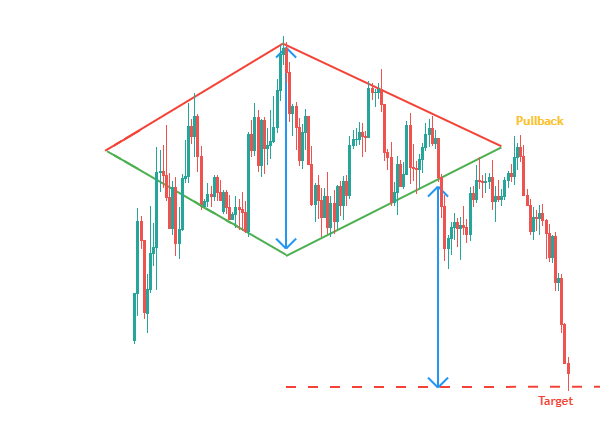
Diamond Top Statistics:
- In 80% of the cases, the output of a top diamond is bearish.
- In 95% of the time, the price target for a top diamond is reached.
The “Head and Shoulders” patterns
1 head and 2 shoulders.
In theory, the height of both shoulders should be the same, and the neck line should be horizontal.
In practice, it often happens that the shoulders are not the same height, or that the neck line is ascending or descending (depending on the shape of the shoulders of the figure).
The first and third trough/peak (approximately the same height) form the shoulders.
The second trough/top (at a height lower/higher than that of the shoulders) forms the head.
There is no fixed rule but some authors consider that the height of the head should be 1.5 to 2 times that of the shoulders.
The neck line is determined by the two highest highs/lows reached after the first shoulder and the head. These two high/low points are not always at the same level. The neck line can therefore be ascending, descending or more rarely, horizontal.
The head and shoulders figure is definitively validated at the break of the neck line. The target price is equal to the height between the neck line and the top of the head, carried over/under the neck line.
Statistics of the inverted head and shoulders figure:
- In 98% of the cases, the output of the inverted head and shoulders pattern is bullish.
- In 74% of the cases, the price achieves the goal of the inverted head and shoulders pattern when the neck line is broken.
- In 97% of the cases, the bullish movement continues at the break of the neck line.
Head and shoulders figure statistics:
- In 93% of the cases, the exit of the head and shoulders pattern is bearish.
- In 63% of the cases, the course achieves the goal of the head and shoulders figure when the neck line is broken.
- In 96% of the cases, the bearish movement continues at the breakout of the neckline.
Source and details : centralcharts.com
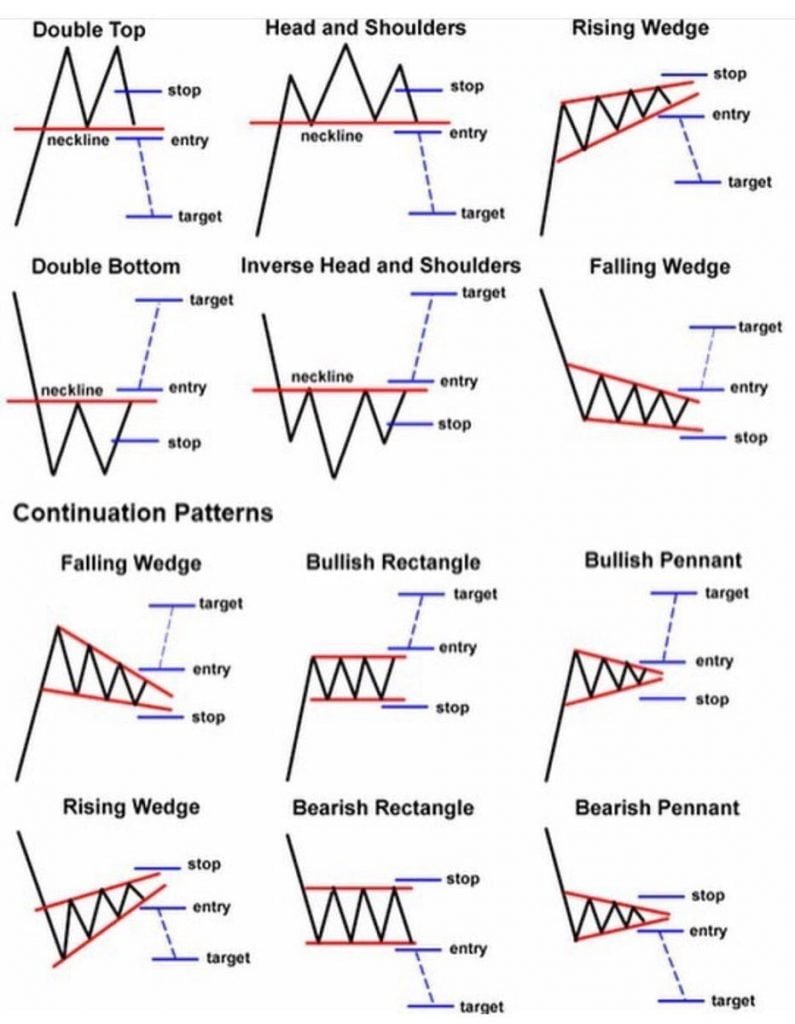
Chartist patterns cheat sheet
Explanatory video
Below, you’ll find an explanatory video of the rules of chart patterns, as well as the use of support and resistance lines, made by our partner Zone9. This content is in French.